From Sustained Momentum to Constrained Supply – Manitoba’s Residential Market from Q1 2024 to Q1 2025
Manitoba’s housing market remained in seller-favourable territory from the start of 2024, up to the first quarter of 2025. Strong year-over-year sales gains, persistently low inventory, and accelerating price growth characterized 2024.
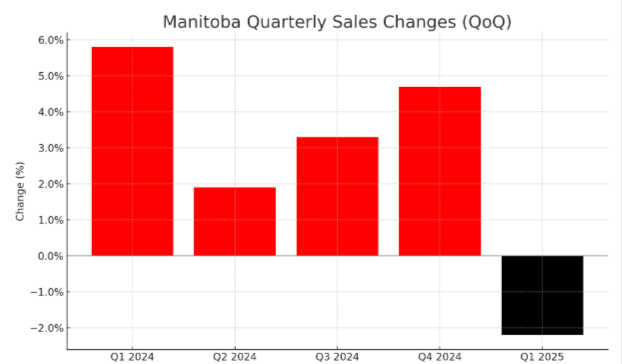
Source: Edge Realty Analytics
The province started Q1 2024 with a 5.8% increase in home sales from the previous quarter and an exceptional 23.2% year-over-year (y/y) jump, reflecting pent-up demand and favourable financing conditions. Q2 2024 saw sales continue to climb, up 1.9% quarter-on-quarter (q/q) and 9.8% year-over-year—albeit at a more moderate clip. By Q3 2024, transactions rose 3.3% q/q and 11.5% y/y, sustaining momentum even as mortgage rates began to edge higher. In Q4 2024, quarterly sales accelerated again, up 4.7%, and were 16.9% above Q4 2023 levels. Early 2025 brought a 2.2% dip in quarterly activity, consistent with typical seasonal patterns, but sales remained a strong 7.1% above Q1 2024.
Listings and Inventory

Source: Edge Realty Analytics

Source: Edge Realty Analytics
Supply constraints were an ongoing factor in the market. New listings fell 1.7% q/q in Q1 2024 but edged up 0.8% y/y. Q2 2024 witnessed another modest decline (-0.7% q/q) but a 2.3% y/y increase. By Q3 2024, new offerings dipped 1.2% q/q yet posted a slight 1.7% y/y gain. Q4 2024 registered a negligible 0.2% q/q uptick but a 4.1% y/y contraction, the first annual supply decline since early 2023. In Q1 2025, new listings ticked up only 0.4% from Q4 but remained 1.2% below Q1 2024.
Active listings consistently faced downward trajectories. From Q1 2024’s 4.7% quarterly decline and 3.4% y/y drop, through successive quarters of deeper contractions – 5.7% q/q (-6.8% y/y) in Q2, 3.1% q/q (-7.1% y/y) in Q3, and 7.3% q/q (-22.3% y/y) in Q4, as stock reached lower levels. By Q1 2025, active inventory shrank another 0.6% from Q4 and plunged 15.5% compared to Q1 2024.
Months of inventory contracted from 2.71 in Q1 2024 to just 2.21 by Q1 2025, well below the six-month threshold for balanced conditions. The sales-to-new listings ratio oscillated around the 70% or higher, with a dip to 67.6% in Q2 2024.
Prices

Source: Edge Realty Analytics
House prices climbed consistently in Manitoba across all quarters.
Construction
Manitoba’s construction pipeline contracted throughout the period. Dwellings under construction fell 4.8% q/q (-10.1% y/y) in Q1 2024, with subsequent drops of 10.8% q/q (-16.2% y/y) in Q2, and a smaller 12.0% annual decline by Q3 despite a 3.1% q/q uptick. Q4 2024 saw a 1.8% q/q and 14.1% y/y decrease. Although Q1 2025 recorded a modest 1.4% q/q rise, construction remained 8.5% below Q1 2024, insufficient to relieve market tightness.


