Ontario Housing Market Shifts to Buyer’s Market: Q1 2024 to Q1 2025 Quarterly Market Update
Over the past five quarters, there has been a shift toward buyer’s market conditions. While population growth remained positive, it moderated toward the end of the period. At the same time, the unemployment rate rose from 6.7% in Q1 2024 to 7.5% in Q1 2025, and rental markets began to soften. Together, these factors contributed to a buildup in resale inventory and mounting downward pressure on home prices.
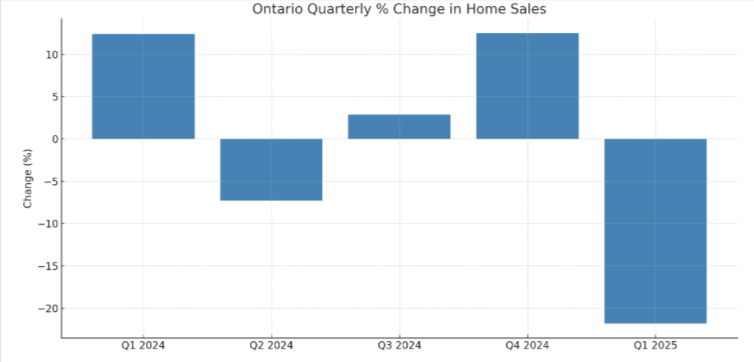
Sales
Source: Edge Realty Analytics
Ontario’s housing market underwent changes in sales activity between early 2024 and early 2025. Sales rose strongly in Q1 2024 and again in Q4, but these periods of heightened demand were bookended by sharp contractions. The most notable drop came in Q1 2025, when sales declined more than 20% both quarter-over-quarter and year-over-year, reversing gains made the previous quarter.
Listings and Inventory

Source: Edge Realty Analytics

Source: Edge Realty Analytics
Supply conditions in Ontario became looser over the five quarters. New listings were consistently elevated year-over-year, and active listings surged, especially in Q2 and Q1 2025. By the start of 2025, active inventory was up over 44% compared to a year earlier—rising as much as 70% year-over-year in parts of the GTA. Months of inventory climbed steadily, reaching 6.15 by Q1 2025, indicating growing market slack and slower absorption of listings.
The sales-to-new listings ratio fell from 48.7% in Q1 2024 to just 35.0% by Q1 2025. Alongside a doubling of active inventory in some regions and falling prices, this marked a turn in market balance.
Prices

Source: Edge Realty Analytics
Home prices in Ontario experienced quarterly declines in Q2 and Q3. Although Q4 brought a brief stabilization, with a small year-over-year increase, this proved temporary. In Q1 2025, prices fell by 3.7% quarter-over-quarter and were 4.0% below the previous year. The short-lived recovery in late 2024 gave way to renewed downward pressure as inventory rose and sales fell.
Construction Activity Continues to Weaken
Residential construction slowed throughout the period. Dwellings under construction declined in every quarter except Q1 2024, and the annual drop reached over 7% by Q1 2025. New condo starts in Toronto fell sharply, with December 2024 recording the lowest monthly total since the mid-1990s. Across the province, sentiment among builders remained low, and single-family permit issuance was at multi-decade lows, suggesting a broad pullback in development activity.


